")

 HOUSEHOLD BUDGET SURVEY (HBS)
Household Budget Surveys are the only truly reliable source of household income and expenditure data, which when combined with other information that is collected produces a rich source of socio-economic data. In addition, to this function, data from the survey have become critical in economic and social policy analyses and development planning. As a result, these surveys are now a central and strategic component in the work programme of national statistical offices and represent a critical link in the statistical infrastructure.
The Central Statistical Office has traditionally conducted Household Budget Surveys (HBS) previously called Household Budgetary Surveys. This tradition began as far back as December 1957 when the first survey was conducted. The second survey followed some thirteen years later in 1971/1972 after which, the time span between surveys narrowed considerably, with the other four surveys occurring in 1975/1976, 1981/1982, 1988 and 1997/1998, 2008/2009 respectively.
In accordance with best practices, this survey should be conducted at least every five (5) years.
The next HBS is scheduled to take place in 2023. However, for the first time in Trinidad and Tobago, The Household Budget Survey would be combined with The Survey of Living Conditions. The both surveys would be merged in order to yield better quality expenditure data, while also providing detailed information on health, education, labour and other characteristics of living conditions.


SURVEY OF LIVING CONDITIONS (SLC)
Surveys of Living Conditions have been utilized as the main source of robust quantitative data to generate key poverty, inequality and vulnerability indicators and to evaluate living conditions at a point in time. The last three surveys were conducted in 1992, 2005 and 2014 respectively. The next SLC is scheduled to take place in 2023 in conjunction with the HBS.

2023 SURVEY OF LIVING CONDITIONS AND HOUSEHOLD BUDGETS (2023 HBS/SLC)
MAIN OBJECTIVES OF THE 2023 HOUSEHOLD BUDGET SURVEY

To collect information to develop a current basket of goods and services consumed by households. This data forms the basis for the revision of the Index of Retail Prices which is used to monitor the rate of inflation.

The inflation rate measures the changes in the purchasing power of money and is closely monitored by economic planners, policy makers, the business community and labour unions.
To provide detailed data on household expenditure and income. To facilitate the construction of poverty lines, various indicators of deprivation and other social research and poverty analyses.
DURATION OF THE 2023 HBS/SLC
The conduct of the HBS/SLC will take place over a period of 12 months commencing in February 2023 and ending in January 2024.
SAMPLE DESIGN AND SELECTION OF THE 2023 HBS/SLC
The 2023 HBS/SLC is a nationally representative survey with coverage across all Cities, Boroughs and Regions in Trinidad and Tobago.
The households for the 2023 HBS/SLC would be randomly selected with a sample of 7200 households spread across the length and breadth of the country.
SURVEY INSTRUMENTS
One questionnaire will be used to capture both household and individual information. A diary will also be issued to the household to keep records of all food items, drinks and readymade meals purchased for a period of two weeks.
If your household falls within the sample, an experienced field interviewer will visit your home and administer the survey. A responsible household member would be asked to keep a log of purchases in the diary provided.
TYPE OF INFORMATION TO BE COLLECTED IN THE 2023 HBS/SLC
| 1. Demographic data e.g. Age, Gender, Marital Status, Religion, Ethnicity etc. |
| 2. Condition of Dwelling, Availability of Water, Electricity, Internet and Other of Household Amenities |
| 3. Expenditure on Health, Education, Entertainment, Personal Care, Clothing and Footwear |
| 4. Expenditure on Dwellings and Household Durables |
| 5. Data on Home Produced Food |
| 6. Income from All Sources |
| 7. Mortality and Migration |
| 8. Social Behaviour |
| 9. Satisfaction with Life |
| 10. Fertility |
| 11. Adult Literacy |

2008/2009 HOUSEHOLD BUDGET SURVEY
HIGHLIGHTS FROM THE 2008/2009 HOUSEHOLD BUDGET SURVEY
Consumption Expenditure Shares 1997/98 HBS and 2008/09 HBS
Households spent a slightly larger proportion on Food and Non-Alcoholic Beverages in 2008/09, the expenditure share of this division increase from 16.0% in 1997/98 to 16.7% in 2008/09. Increased expenditure shares were also recorded for Furnishings, Household Equipment and Routine Maintenance from 5.2% in 1997/98 to 6.5% in 2008/09 and Gifts from 0.7% to 1.9%. An exceptionally large increase in expenditure share was observed for Miscellaneous Goods which increased its share from 2.6% in 1997/98 to 8.4% in 2008/09 however this upward change in part reflects improved coverage in this division.
The expenditure share of Housing, Water, Electricity, Gas and Other Fuels declined marginally from 27.1% to 26.5%. Declining shares were also reported for Alcoholic Beverages and Tobacco from 1.5% to 0.8%, Clothing and Footwear from 6.3% to 5.8%, Communications from 4.7% to 4.4%, Education from 2.8% to 1.1%, Health from 4.5% to 4.0%, Recreation and Culture from 7.7% to 6.7%, Restaurants and Hotels from 3.2% to 2.5%, Transport from 16.6% to 14.3% and Home Produced Food from 1.2% to 0.5%.
| Expenditure Division | Percentage Share of Consumption Expenditure | ||
| Expenditure Division | 1997/98 HBS | 2008/09 HBS | |
| Total Consumption Expenditure | 100.0 | 100.0 | |
| Food and Non Alcoholic Beverages | 16.0 | 16.7 | |
| Alcoholic Beverages and Tobacco | 1.5 | 0.8 | |
| Clothing and Footwear | 6.3 | 5.8 | |
| Housing, Water, Electricity, Gas and Other Fuels | 27.1 | 26.5 | |
| Furnishings, Household Equipment and Routine Maintenance | 5.2 | 6.5 | |
| Health | 4.5 | 4.0 | |
| Transport | 16.6 | 14.3 | |
| Communications | 4.7 | 4.4 | |
| Recreation and Culture | 7.7 | 6.7 | |
| Education | 2.8 | 1.1 | |
| Restaurant and Hotels | 3.2 | 2.5 | |
| Miscellaneous Goods | 2.6 | 8.4 | |
| Home Produced Food | 1.2 | 0.5 | |
| Gifts Received | 0.7 | 1.9 | |
Average Monthly Household Consumption Expenditure
Significant regional differences were observed in the level of average monthly household consumption expenditure. Households resident in the region of Diego Martin reported the highest level of average monthly household consumption expenditure, $8,733.1 this was followed by Couva/Tabaquite//Talparo $7,969.2 and Tunapuna/Piarco $7,718.0. Households in Siparia $5,543.5 and Mayaro/Rio Claro $5,093.7 recorded the lowest levels.
Average Monthly Household Income
Average monthly household income in Trinidad and Tobago in 2008/09 was $9,201.9. This represented an increase of 108.3% since the last HBS. Average gross monthly income (money income) grew by 106.9% to reach $ 7,964.9 over the same period.
At the regional level, households resident in Diego Martin reported the highest average monthly household income ($10,555.2) while households in Tobago ($7,084.0) and Mayaro/Rio Claro (7,308.5) reported the lowest.
SAMPLE DESIGN AND SELECTION OF THE 2008/2009 HBS/SLC
The sample design utilized was a stratified two stage cluster sample of households divided into twelve equal sub samples so that each sub sample was nationally representative by region and income area.
The sample was stratified by region to ensure a geographic representative sample of Trinidad and Tobago. Enumeration districts within regions formed the first stage, sampling unit while households within the selected enumeration district represented the second stage, or ultimate sampling units. The first stage sampling units were selected with probability proportional to size, in all one thousand nine hundred and twenty (1920) Enumeration Districts were selected this was equivalent to 80% of all Enumeration Districts. A compact cluster of four (4) households was then selected in each Enumeration District. Each sub-sample was subdivided into two periods for ease of enumeration so that the total sample was spread across twenty-four periods or fortnights. Three hundred and twenty (320) households were selected during each period.
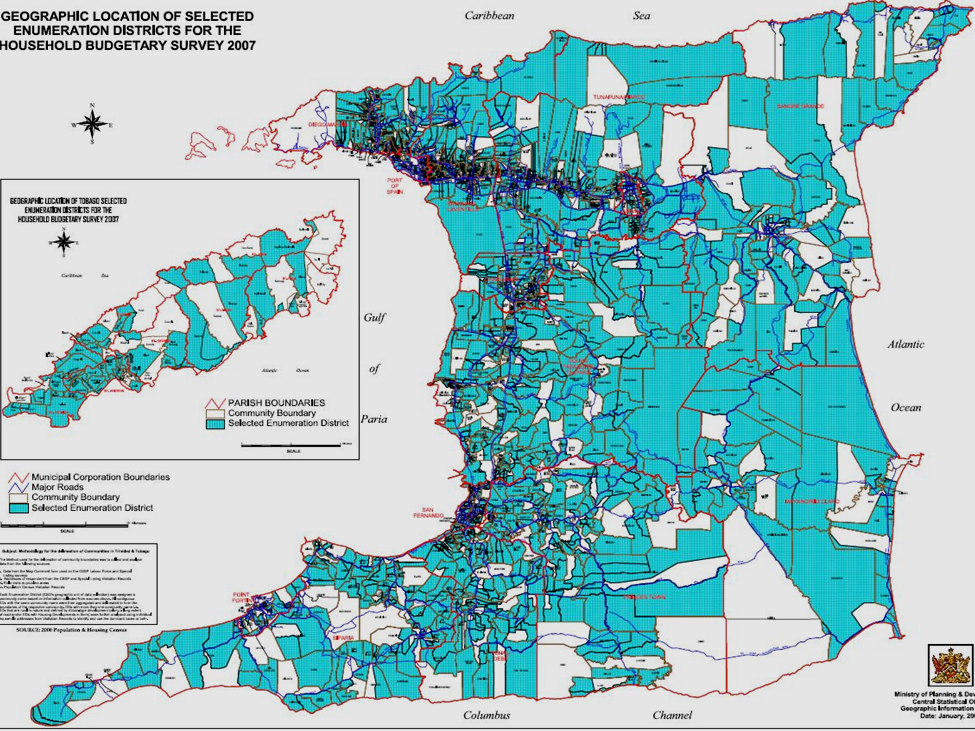
LOCATION OF ENUMERATION DISTRICTS SELECTED IN THE SAMPLE
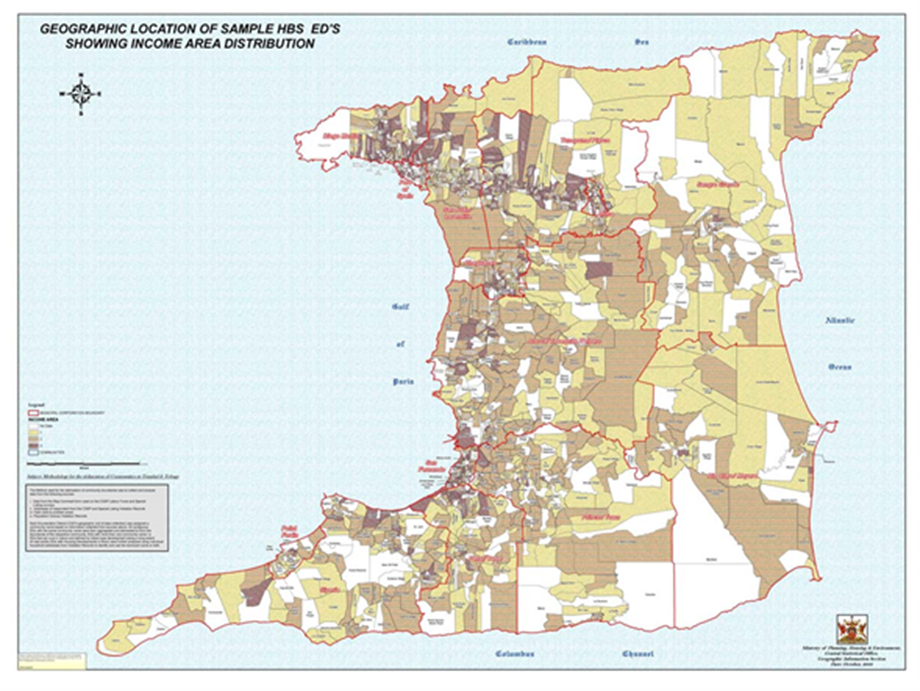
DISTRIBUTION OF ENUMERATION DISTRICTS BY INCOME AREA
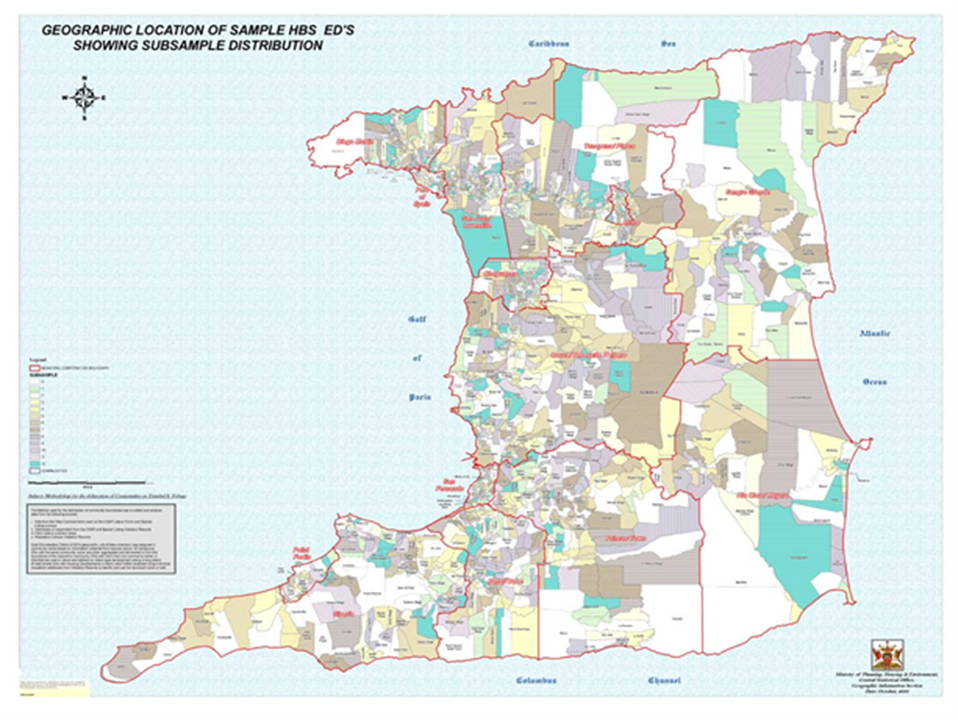
DISTRIBUTION OF ENUMERATION DISTRICTS BY SUB-SAMPLE
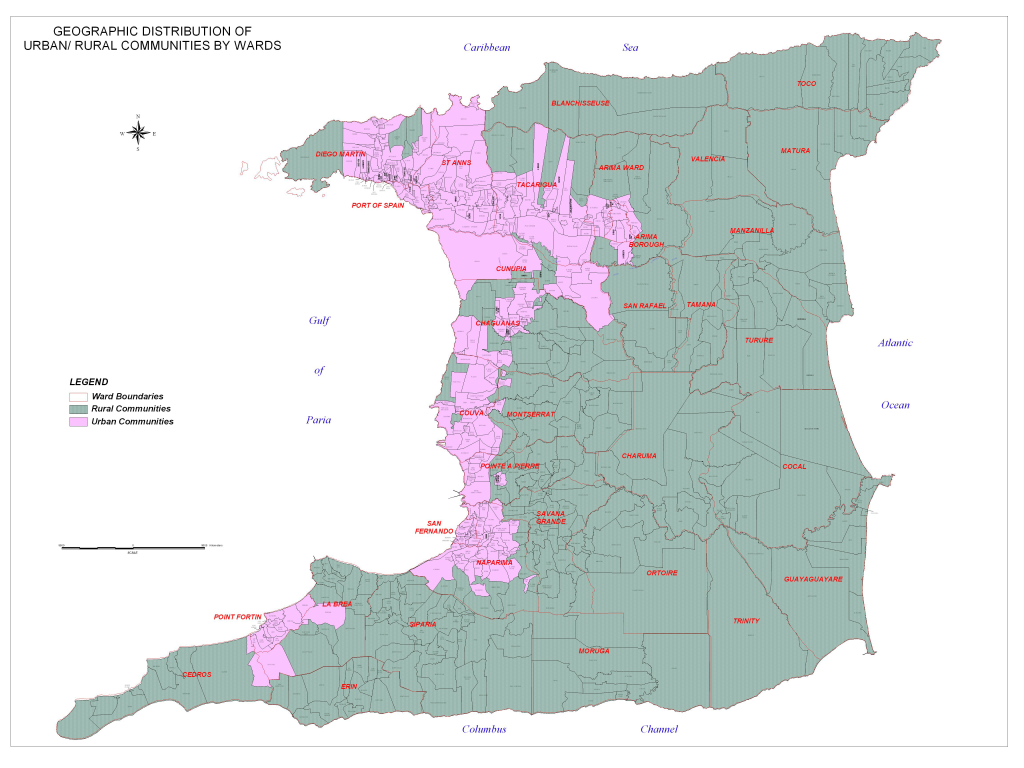
GEOGRAPHIC DISTRIBUTION OF URBAN/RURAL COMMUNITIES BY WARDS
TABLES FROM THE 2008/2009 HOUSEHOLD BUDGET SURVEY
 Demographic-Characteristics
DOCUMENTS FROM THE 2008/2009 HOUSEHOLD BUDGET SURVEY


2008/2009 HBS DATA TABLES

Download data tables in MS Excel  xls formats.
Section 1 : Summary Characteristics of Households
Section 2: Distribution of Households
Section 3: Dwelling Unit Conditions, Facilities and Durables
Section 4: Household Monthly Income
Section 5: Household Consumption Expenditure